GPU from Silicon to Container, Part 3: CDI, Dynamic Resource Allocation & Operating GPUs in Kubernetes
Part 3 of a 3-part series on how Kubernetes makes GPUs accessible to containers, this final part covers the Container Device Interface, Dynamic Resource Allocation, and running GPUs reliably in production.
Introduction
This is the final part of a 3-part series. Part 1 covered GPU provisioning from silicon to a scheduled pod; Part 2 covered splitting a physical GPU across workloads with time-slicing, MPS, MIG, HAMi, and vGPU. This part covers the standard that those sharing mechanisms and Kubernetes GPU scheduling itself are moving to, and what it takes to operate it.
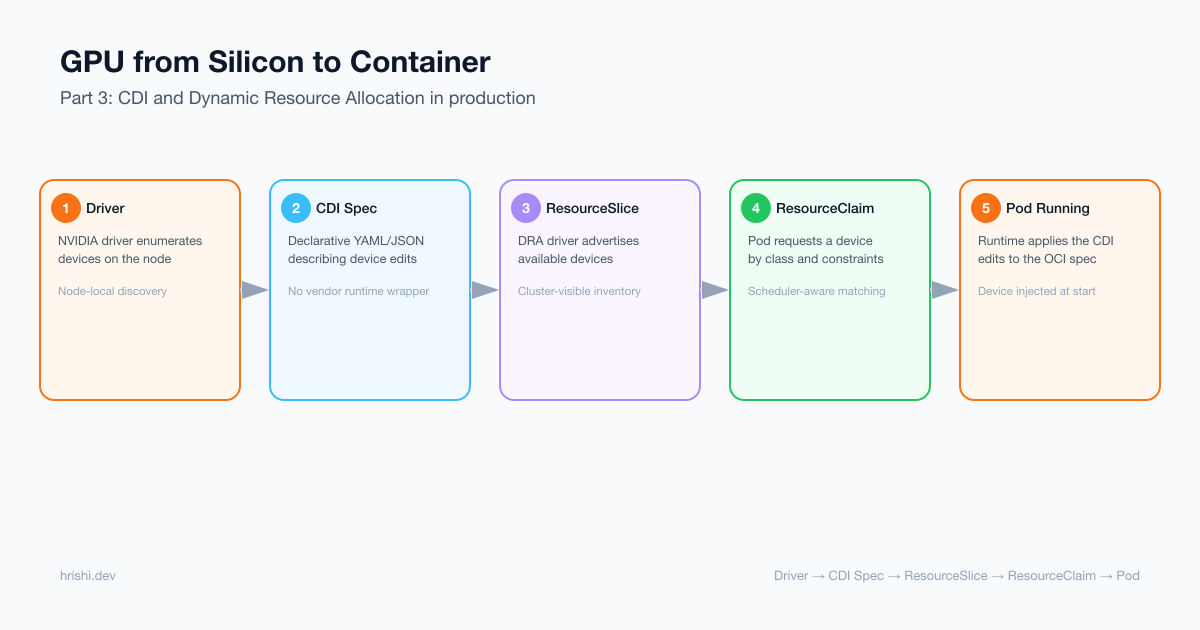
Table of Contents
Next Container Technologies
- The Container Device Interface (CDI) Revolution
- Dynamic Resource Allocation (DRA): Next-Generation GPU Scheduling
Operations
- GPU Operator Troubleshooting
- Installing the NVIDIA DRA Driver via Helm
- GPU Fleet Reliability: Metrics and SLOs
The Container Device Interface (CDI) Revolution
In 2023-2024, the container ecosystem began transitioning to the Container Device Interface (CDI), a standardized specification that fundamentally changes how devices are exposed to containers.
The Problem CDI Solves
The Old Way: Vendor Specific Runtime Hooks
Before CDI, each hardware vendor needed custom integration:
Container Runtime (containerd)
              ↓
nvidia-container-runtime (wrapper) ← NVIDIA-specific
              ↓
nvidia-container-runtime-hook ← Vendor logic
              ↓
nvidia-container-cli ← Device provisioning
Problem:
- AMD needed rocm-container-runtime, Intel their own. Every implementation is reinventing the wheel to a certain extent, thus solving the same problem differently
- Since device plugin implementations wrap the container runtime, you end up building a plugin for every container runtime
- All extended container resources need to be associated with a particular runtimeClass and need container runtime configuration changes, which is error-prone
The New Way: Declarative Device Specifications
Instead of runtime hooks, CDI uses a static YAML (or JSON) file on each node that declaratively describes everything a runtime needs to inject a device into a container: device nodes, library mounts, environment variables, and hooks. The NVIDIA Container Toolkit generates these files once via nvidia-ctk cdi generate; the NVIDIA DRA driver generates them dynamically at allocation time or when standing up a device plugin.
The container runtime reads this file at container creation time and applies the edits directly to the OCI spec, so no vendor wrapper is required and the
pod doesn’t need to set the runtimeClassName.
CDI Architecture
Container Orchestrator (Kubernetes, Podman, Docker)
              ↓  Request: nvidia.com/gpu=0
Container Runtime (containerd, CRI-O, Docker)
  + Native CDI Support
              ↓  Reads CDI specs from disk
CDI Specification Files (YAML or JSON)
  /etc/cdi/*.yaml ← static, admin-gen
  /var/run/cdi/*.yaml ← dynamic, runtime
              ↓  Describes device configuration
Host System Resources
  - Device nodes (/dev/nvidia*)
  - Libraries (libcuda.so, etc.)
  - Utilities (nvidia-smi)
A CDI spec file (/etc/cdi/nvidia.yaml) is generated once by nvidia-ctk and contains three main sections:
# /etc/cdi/nvidia.yaml
cdiVersion: "0.6.0"          # CDI specification version
kind: nvidia.com/gpu          # Fully-qualified device kind (vendor.com/type)
                              # Prevents collisions: nvidia.com/gpu, amd.com/gpu, intel.com/gpu
devices:
  - name: "0"
    containerEdits:           # Everything to inject for this device
      deviceNodes:
        - path: /dev/nvidia0
          type: c
          major: 195
          minor: 0
        - path: /dev/nvidiactl
          type: c
          major: 195
          minor: 255
        - path: /dev/nvidia-uvm
          type: c
          major: 511  # dynamically assigned by kernel: verify with `ls -l /dev/nvidia-uvm`
          minor: 0
      mounts:
        - hostPath: /usr/lib/x86_64-linux-gnu/libcuda.so.535.104.05
          containerPath: /usr/lib/x86_64-linux-gnu/libcuda.so.1
          options: ["ro", "nosuid", "nodev", "bind"]
        - hostPath: /usr/lib/x86_64-linux-gnu/libnvidia-ml.so.535.104.05
          containerPath: /usr/lib/x86_64-linux-gnu/libnvidia-ml.so.1
          options: ["ro", "nosuid", "nodev", "bind"]
        - hostPath: /usr/bin/nvidia-smi
          containerPath: /usr/bin/nvidia-smi
          options: ["ro", "nosuid", "nodev", "bind"]
      env:
        - "NVIDIA_VISIBLE_DEVICES=0"
        - "NVIDIA_DRIVER_CAPABILITIES=compute,utility"
      hooks:
        - hookName: createContainer
          path: /usr/bin/nvidia-ctk
          args: ["hook", "update-ldcache"]

  - name: "1"
    containerEdits:
      deviceNodes:
        - path: /dev/nvidia1
          type: c
          major: 195
          minor: 1
        - path: /dev/nvidiactl
          type: c
          major: 195
          minor: 255
        - path: /dev/nvidia-uvm
          type: c
          major: 511  # dynamically assigned by kernel: verify with `ls -l /dev/nvidia-uvm`
          minor: 0
      mounts:
        # ... same libraries as device "0" ...
      env:
        - "NVIDIA_VISIBLE_DEVICES=1"
        - "NVIDIA_DRIVER_CAPABILITIES=compute,utility"
What real
nvidia-ctk cdi generateoutput looks like: themounts/hostPathpairing above is simplified for readability. Current toolkit versions (e.g. driver 580.173.02) instead bind-mount the versioned host libraries once and use a dedicatedcreateContainerhook,nvidia-cdi-hook create-symlinks, to build every.so→.so.1/.so.Nsymlink a container needs,libcuda.so.1,libnvidia-ml.so.1,libnvcuvid.so.1,libnvidia-opencl.so.1, and more, each passed as a--link target::linknameargument. This avoids baking exact driver-version filenames into every mount and keeps symlink creation as an explicit, inspectable step rather than an implicit side effect of the bind mount.
CDI vs Traditional Flow Comparison
Traditional NVIDIA Container Toolkit Flow
User: docker run --gpus all nvidia/cuda
              ↓
Docker daemon
              ↓  calls
nvidia-container-runtime
              ↓  wraps
runc
              ↓  prestart hook
nvidia-container-runtime-hook
              ↓  reads --gpus flag, NVIDIA_VISIBLE_DEVICES
nvidia-container-cli
              ↓  dynamically queries
nvidia-smi
              ↓  determines devices, libraries, mounts
Modify OCI spec on-the-fly (adds devices, mounts, env)
              ↓
runc creates container with GPU access
Characteristics:
- Dynamic device discovery at container start
- Runtime wrapper required
- Vendor-specific magic in environment variables
- Black box: hard to inspect what’s being configured
CDI-Based Flow
[one-time setup, on node]
nvidia-ctk cdi generate --output=/etc/cdi/nvidia.yaml
              ↓
User: docker run --device nvidia.com/gpu=0 nvidia/cuda
              ↓
containerd (native CDI support) receives request
              ↓  parses CDI device name: nvidia.com/gpu=0
Look up device in /etc/cdi/nvidia.yaml
              ↓
Read containerEdits for device 0
              ↓  applies edits to OCI spec
  - Adds device nodes
  - Adds mounts
  - Sets environment variables
  - Registers hooks
              ↓
runc creates container with GPU access
Characteristics:
- Static device specification (generated once)
- No runtime wrapper or runtime hooks are needed
- Standard OCI runtime (runc) works unmodified
- Transparent: inspect CDI specs to see exact configuration
- Vendor provides only CDI spec generator
CDI in Kubernetes
The device plugin is now responsible for adhering to the CDI specification.
Pre-CDI Device Plugin
func (m *NvidiaDevicePlugin) Allocate(
    req *pluginapi.AllocateRequest,
) (*pluginapi.AllocateResponse, error) {
    responses := pluginapi.AllocateResponse{}

    for _, request := range req.ContainerRequests {
        // Device plugin must know HOW to provision GPU
        response := pluginapi.ContainerAllocateResponse{
            Envs: map[string]string{
                "NVIDIA_VISIBLE_DEVICES": "GPU-uuid-1234",
            },
            Mounts: []*pluginapi.Mount{
                {
                    HostPath: "/usr/lib/x86_64-linux-gnu/libcuda.so",
                    ContainerPath: "/usr/lib/x86_64-linux-gnu/libcuda.so",
                    ReadOnly: true,
                },
                // ... many more mounts ...
            },
            Devices: []*pluginapi.DeviceSpec{
                {
                    HostPath: "/dev/nvidia0",
                    ContainerPath: "/dev/nvidia0",
                    Permissions: "rwm",
                },
                {
                    HostPath: "/dev/nvidiactl",
                    ContainerPath: "/dev/nvidiactl",
                    Permissions: "rwm",
                },
                // ... more devices ...
            },
        }
        responses.ContainerResponses = append(
            responses.ContainerResponses,
            &response,
        )
    }

    return &responses, nil
}
Post-CDI Device Plugin
func (m *NvidiaDevicePlugin) Allocate(
    req *pluginapi.AllocateRequest,
) (*pluginapi.AllocateResponse, error) {
    responses := pluginapi.AllocateResponse{}

    for _, request := range req.ContainerRequests {
        // Device plugin just returns CDI device names!
        var cdiDevices []string
        for _, deviceID := range request.DevicesIDs {
            cdiDevices = append(
                cdiDevices,
                fmt.Sprintf("nvidia.com/gpu=%s", deviceID),
            )
        }

        response := pluginapi.ContainerAllocateResponse{
            CDIDevices: cdiDevices,  // That's it!
        }
        responses.ContainerResponses = append(
            responses.ContainerResponses,
            &response,
        )
    }

    return &responses, nil
}
Key simplification: The device plugin no longer needs vendor-specific knowledge about mounts, device nodes, or environment variables. It simply returns CDI device identifiers.
Container Runtime Integration
When kubelet creates a container with CDI devices:
kubelet receives CDI device names from device plugin:
  ['nvidia.com/gpu=0', 'nvidia.com/gpu=1']
              ↓
kubelet adds CDI annotation to container config:
  annotations: { 'cdi.k8s.io/devices': 'nvidia.com/gpu=0,nvidia.com/gpu=1' }
              ↓
kubelet → containerd CRI: CreateContainer
              ↓
containerd reads CDI annotation
              ↓
containerd loads CDI registry from
  /etc/cdi/*.yaml and /var/run/cdi/*.yaml
              ↓
For each CDI device:
  registry.GetDevice('nvidia.com/gpu=0')
  registry.GetDevice('nvidia.com/gpu=1')
              ↓
Applies container edits to OCI spec:
  - Merges all device nodes
  - Merges all mounts
  - Merges all environment variables
  - Collects all hooks
              ↓
Creates final OCI spec and calls runc
Generating CDI Specifications
NVIDIA Container Toolkit
# Basic generation
nvidia-ctk cdi generate --output=/etc/cdi/nvidia.yaml

# With custom options
nvidia-ctk cdi generate \
  --output=/etc/cdi/nvidia.yaml \
  --format=yaml \
  --device-name-strategy=index \
  --driver-root=/ \
AMD ROCm
rocm-smi --showdriverversion
rocm-cdi-generator --output=/etc/cdi/amd.yaml
Dynamic Resource Allocation (DRA): Next-Generation GPU Scheduling
The Device Plugin framework (Part 1) works well for simple whole-GPU assignment, but it has fundamental limitations
when workloads need fine-grained control: specific MIG profiles, multi-node NVLink topology, shared resources, or
per-claim lifecycle management. Kubernetes Dynamic Resource Allocation (DRA), in beta behind a feature gate
since 1.32 and stabilised in resource.k8s.io/v1 from Kubernetes 1.34, addresses these limitations by replacing
the opaque device plugin gRPC API with a structured, declarative model visible to the scheduler.
The official DRA driver for NVIDIA GPUs is maintained at
github.com/kubernetes-sigs/dra-driver-nvidia-gpu under the kubernetes-sigs organisation.
Why Device Plugin Falls Short
Resource granularity. The device plugin API only knows how to hand out whole devices: a GPU is a GPU. MIG
support, covered in Part 2, isn’t
modeled by the API at all; it’s bolted on by advertising each MIG profile as its own resource name
(nvidia.com/mig-3g.20gb), which the scheduler treats no differently than a whole GPU.
Topology awareness. The scheduler filters and scores nodes purely on resource counts; it has no concept of which GPUs on a node share an NVLink bridge or sit on the same NUMA node. A pod can land with “2 GPUs available” satisfied while those two GPUs are on opposite ends of the PCIe topology, silently tanking any workload that assumed NVLink-speed interconnect between them.
Shared resources. There’s no first-class notion of multiple pods sharing a device. Time-slicing (Part 2) only works because the NVIDIA device plugin lies to the scheduler, advertising one physical GPU as several schedulable “replicas,” not because the API itself understands sharing.
Lifecycle and scheduling. A GPU is bound to a pod the moment the plugin’s Allocate() call returns, for the
life of that pod. There’s no way to pre-allocate a device ahead of a pod being scheduled, or to have two pods
coordinate over the same device via the API. So anything like that has to be built outside Kubernetes’s allocation
model entirely.
Introspection. Once Allocate() returns, the control plane has no idea what actually got handed out, which
physical GPU, which MIG slice, which UUID. That information lives only inside the device plugin’s own state,
invisible to kubectl or the scheduler, which makes debugging placement issues or building topology-aware
tooling on top of it much harder than it should be.
Error-prone recovery. Hand-carving MIG instances outside the device plugin’s view makes this worse: the MIG Manager has no way to reconcile a layout it didn’t create, so its record of “current state” quietly drifts from what’s actually on the GPU. Because the scheduler has no visibility into actual GPU state, a pod can get stuck in a container creation error with no escape hatch to recover from such state without manual intervention.
DRA Core Concepts
DRA replaces the device plugin gRPC interface with three Kubernetes API objects.
ResourceSlice: Driver Advertises Devices
A DRA driver publishes ResourceSlice objects (one per node) instead of calling ListAndWatch().
Each slice describes the devices on that node with structured, queryable attributes:
apiVersion: resource.k8s.io/v1
kind: ResourceSlice
metadata:
  name: node-gpu-01-nvidia-gpus
spec:
  driver: gpu.nvidia.com
  pool:
    name: node-gpu-01
    resourceSliceCount: 1
  nodeName: node-gpu-01
  devices:
  - name: gpu-0
    basic:
      attributes:
        uuid:        { string: "GPU-a4f8c2d1-e5f6-7a8b-9c0d-1e2f3a4b5c6d" }
        model:       { string: "NVIDIA H100 SXM5 80GB" }
        profile:     { string: "3g.20gb" }        # populated for MIG slices
        parentUUID:  { string: "GPU-a4f8c2d1..." } # used for co-location constraints
      capacity:
        memory: 80Gi
DeviceClass: Cluster Policy for a Device Type
DeviceClass is a cluster-scoped object set by administrators. The NVIDIA DRA driver registers two device classes out of the box:
-
gpu.nvidia.com: whole GPU devices -
mig.nvidia.com: MIG (Multi-Instance GPU) slices
ResourceClaim: User Requests Devices
Instead of resources.limits.nvidia.com/gpu: 1, a workload creates a ResourceClaim.
The exactly: stanza specifies how many devices are required and optional CEL selectors:
# Two pods, each getting their own single GPU
apiVersion: resource.k8s.io/v1
kind: ResourceClaimTemplate       # per-pod claims for Jobs / Deployments
metadata:
  namespace: gpu-test1
  name: single-gpu
spec:
  spec:
    devices:
      requests:
      - name: gpu
        exactly:
          deviceClassName: gpu.nvidia.com
---
apiVersion: v1
kind: Pod
metadata:
  namespace: gpu-test1
  name: pod1
spec:
  resourceClaims:
  - name: gpu
    resourceClaimTemplateName: single-gpu
  containers:
  - name: ctr
    image: ubuntu:22.04
    command: ["bash", "-c"]
    args: ["nvidia-smi -L; trap 'exit 0' TERM; sleep 9999 & wait"]
    resources:
      claims:
      - name: gpu
  tolerations:
  - key: "nvidia.com/gpu"
    operator: "Exists"
    effect: "NoSchedule"
Two containers in the same pod can share one GPU claim by both referencing the same entry:
# One pod, two containers sharing one GPU
apiVersion: resource.k8s.io/v1
kind: ResourceClaimTemplate
metadata:
  namespace: gpu-test2
  name: single-gpu
spec:
  spec:
    devices:
      requests:
      - name: gpu
        exactly:
          deviceClassName: gpu.nvidia.com
---
apiVersion: v1
kind: Pod
metadata:
  namespace: gpu-test2
  name: shared-gpu-pod
spec:
  resourceClaims:
  - name: shared-gpu
    resourceClaimTemplateName: single-gpu
  containers:
  - name: ctr0
    image: ubuntu:22.04
    command: ["bash", "-c"]
    args: ["nvidia-smi -L; trap 'exit 0' TERM; sleep 9999 & wait"]
    resources:
      claims:
      - name: shared-gpu   # both containers reference the same claim
  - name: ctr1
    image: ubuntu:22.04
    command: ["bash", "-c"]
    args: ["nvidia-smi -L; trap 'exit 0' TERM; sleep 9999 & wait"]
    resources:
      claims:
      - name: shared-gpu   # both containers reference the same claim
  tolerations:
  - key: "nvidia.com/gpu"
    operator: "Exists"
    effect: "NoSchedule"
NVIDIA DRA Driver (dra-driver-nvidia-gpu)
The driver is maintained at github.com/kubernetes-sigs/dra-driver-nvidia-gpu and ships two kubelet plugins:
| Plugin | Status | Purpose |
|---|---|---|
gpu-kubelet-plugin |
Experimental | Whole-GPU and MIG device allocation |
compute-domain-kubelet-plugin |
Officially supported | Multi-Node NVLink / ComputeDomain orchestration |
Architecture
kube-apiserver
  ResourceSlice, ResourceClaim, DeviceClass
              ↓
kube-scheduler (DRA-aware)
  Reads ResourceSlice attributes via CEL
  Writes allocation into ResourceClaim.status
              ↓
kubelet
  Calls DRA plugin NodePrepareResources() gRPC
              ↓
dra-driver-nvidia-gpu: three independently deployed components:
  ├─ gpu-kubelet-plugin (experimental, DaemonSet on every GPU node)
  │    - NodePrepareResources / NodeUnprepareResources
  │    - Writes CDI spec for the allocated GPU/MIG slice
  ├─ compute-domain-kubelet-plugin (supported, DaemonSet on every GPU node)
  │    - Orchestrates IMEX daemons, domains, channels
  │    - Guarantees NVLink-reachability across nodes
  └─ controller (Deployment, control-plane)
       - Publishes ResourceSlice objects per node
       - Watches GPU inventory changes
              ↓  CDI device name
containerd (CDI-aware)
  Reads CDI spec, injects devices/libs/env
MIG Allocation via DRA
DRA makes MIG allocation first-class. The mig.nvidia.com DeviceClass exposes individual MIG slices
as devices in ResourceSlice. CEL selectors on the profile attribute replace the separate
nvidia.com/mig-3g.20gb resource names used by the gpu kubelet plugin.
The matchAttribute constraint ensures all requested slices come from the same physical GPU:
apiVersion: resource.k8s.io/v1
kind: ResourceSlice
metadata:
  name: computeinstance-e00xn5mewbsmgdd98v-gpu.nvidia.com-pjtvh
spec:
  devices:
  - attributes:
      parentUUID:
        string: GPU-8ce1d817-8c25-50db-af0c-242b5437297f
      productName:
        string: NVIDIA H100 80GB HBM3
      profile:
        string: 4g.40gb
    capacity:
      memory:
        value: 40448Mi
      multiprocessors:
        value: "64"
    name: gpu-0-mig-4g40gb-5-0
  - attributes:
      parentUUID:
        string: GPU-8ce1d817-8c25-50db-af0c-242b5437297f
      productName:
        string: NVIDIA H100 80GB HBM3
      profile:
        string: 3g.40gb
    capacity:
      memory:
        value: 40448Mi
      multiprocessors:
        value: "60"
    name: gpu-0-mig-3g40gb-9-4
apiVersion: resource.k8s.io/v1
kind: ResourceClaimTemplate
metadata:
  name: vllm-gpu
spec:
  spec:
    devices:
      requests:
      - name: gpu
        exactly:
          deviceClassName: mig.nvidia.com
          selectors:
          - cel:
              expression: "device.attributes['gpu.nvidia.com'].profile == '4g.40gb' || device.attributes['gpu.nvidia.com'].profile == '3g.40gb'"
              # this allocates both Migs
      constraints:
      - requests: []
        matchAttribute: "gpu.nvidia.com/parentUUID"  # all slices from one GPU
The driver handles MIG instance creation and teardown as part of the claim lifecycle, hence no manual
nvidia-smi mig commands needed.
NOTE: This closes the error-prone recovery gap described earlier: DRA allocates MIG instances dynamically instead of requiring the manual hand-carving the MIG Manager can’t reconcile.
ComputeDomains: Multi-Node NVLink (Officially Supported)
A ComputeDomain (CD) is an abstraction for robust, secure Multi-Node NVLink (MNNVL) connectivity, the kind of setup that turns a rack of GB200 NVL72-class or Vera Rubin NVL72 nodes into what’s effectively one supercomputer, with chip-to-chip bandwidth around 1.8 TB/s to 3.6 TB/s. Without ComputeDomains, wiring that up means hand-managing the low-level NVLink fabric topology yourself; the driver instead gives you a Kubernetes object and does the orchestration underneath it (optimal placement policies).
It guarantees two things for pods inside the domain:
- MNNVL-reachability between them, and isolation from pods outside it.
- That isolation is implemented via IMEX (Internode Memory Exchange): the driver launches and configures the IMEX daemons, domains, and channels for you, rather than requiring a manually managed IMEX deployment alongside the workload.
apiVersion: resource.nvidia.com/v1beta1
kind: ComputeDomain
metadata:
  name: compute-domain
spec:
  numNodes: 18
  channel:
    resourceClaimTemplate:
      name: compute-domain-channel
---
apiVersion: apps/v1
kind: Deployment
metadata:
  name: test-workload
  labels:
    app: test-workload
spec:
  replicas: 18
  selector:
    matchLabels:
      app: test-workload
  template:
    metadata:
      labels:
        app: test-workload
    spec:
      containers:
      - name: ctr
        image: ubuntu:22.04
        command: ["test-workload"]
        resources:
          limits:
            nvidia.com/gpu: 4
          claims:
          - name: channel
      resourceClaims:
      - name: channel
        resourceClaimTemplateName: compute-domain-channel #compute-domain claim from the first resource
Combining a ComputeDomain with a per-node topology constraint is where DRA’s two topology mechanisms, single-node
PCIe placement and multi-node NVLink placement, stack. Each replica below still joins the shared ComputeDomain for
MNNVL-reachability across nodes, but it also carries its own ResourceClaimTemplate that requests a GPU and its
RDMA NIC together and constrains them to the same PCIe root switch, so GPUDirect RDMA traffic to other racks never
has to cross a NUMA boundary to get off the node:
apiVersion: resource.k8s.io/v1
kind: ResourceClaimTemplate
metadata:
  name: gpu-nic-claim
spec:
  spec:
    devices:
      requests:
      - name: gpu
        exactly:
          deviceClassName: gpu.example.com
          count: 1
      - name: nic
        exactly:
          deviceClassName: dranet
          count: 1
      constraints:
      # Ensure the GPU and its RDMA NIC share the same PCIe root switch
      - requests: ["gpu", "nic"]
        matchAttribute: resource.kubernetes.io/pcieRoot
---
apiVersion: resource.nvidia.com/v1beta1
kind: ComputeDomain
metadata:
  name: compute-domain
spec:
  numNodes: 18
  channel:
    resourceClaimTemplate:
      name: compute-domain-channel
---
apiVersion: apps/v1
kind: Deployment
metadata:
  name: training-worker
  labels:
    app: training-worker
spec:
  replicas: 18
  selector:
    matchLabels:
      app: training-worker
  template:
    metadata:
      labels:
        app: training-worker
    spec:
      containers:
      - name: trainer
        image: registry.example.com/trainer:latest
        resources:
          claims:
          - name: devices
          - name: channel
      resourceClaims:
      - name: devices
        resourceClaimTemplateName: gpu-nic-claim
      - name: channel
        resourceClaimTemplateName: compute-domain-channel
The devices claim and the channel claim are independent requests resolved by the same scheduling pass: devices
pins the GPU and its RDMA NIC to one PCIe root on whichever node the pod lands on, and channel binds that pod into
the ComputeDomain so its GPU stays MNNVL-reachable from the other 17 replicas. That’s the topology-awareness gap
called out earlier under Why Device Plugin Falls Short, now closed at both
scales at once: a device plugin can hand out “2 GPUs” independently, with no way to guarantee they share a PCIe
switch with the NIC that carries their traffic off-node, and no notion of a fabric spanning nodes at all.
NOTE:
ComputeDomainitself only ever aligns GPUs. It’s a Kubernetes abstraction over IMEX (Internode Memory Exchange) channels, the mechanism that lets GPUs on separate nodes read and write each other’s memory over Multi-Node NVLink; it has no concept of CPU, PCIe root, or NUMA placement. Thedevicesclaim above is doing the GPU/NIC PCIe-root alignment entirely on its own, via thedranetDeviceClass, a separate DRA driver with no relationship toComputeDomain;channeljust adds GPU-to-GPU reachability across nodes on top of it. The two are independently scheduled and satisfied,ComputeDomaindoesn’t know or care what else a claim in the same pod is requesting.It’s also not RDMA. IMEX moves memory over the NVLink/NVSwitch fabric via CUDA’s fabric-memory export/import calls, a different transport from the GPUDirect RDMA the
gpu-nic-claimabove is set up to accelerate, and NVIDIA’s own docs treat them as distinct: disabling MNNVL makes NCCL “fall back to the available network configurations… such as InfiniBand or Ethernet (RoCE),” which only makes sense if the two are separate paths, not the same one.ComputeDomainnever touches the RDMA NIC itself; that’s entirely thedranetclaim’s job.
Unlike the experimental GPU plugin, ComputeDomain support is officially maintained and production-ready but two details matter before you treat it as a hard multi-tenancy boundary:
- The isolation guarantee is scoped to namespaces, not workloads. A job in namespace A can never join a ComputeDomain created for namespace B, but two workloads sharing a namespace aren’t protected from each other the same way. Treat “one ComputeDomain, one namespace, one tenant” as the safe default, not an incidental detail.
- ComputeDomains are ephemeral, tied to the workload’s lifetime. The domain forms around the pods as they’re scheduled and tears down when the job completes; there’s no long-lived, pre-provisioned domain sitting idle waiting for work the way a MIG slice can.
Above the DRA layer, NCCL 2.25+ is the minimum version with MNNVL support. Hence an older NCCL in your training image will simply not use the NVLink fabric a ComputeDomain gives it, silently falling back to slower interconnects instead of failing outright.
DRA Scheduling Flow
User creates ResourceClaim (status: unallocated)
              ↓
kube-scheduler reads ResourceSlice objects from all nodes
              ↓
Evaluates CEL selectors against device attributes
              ↓
Scores and selects the best matching node
              ↓
Scheduler writes result into ResourceClaim.status.allocation:
  { 'devices': { 'results': [
  { 'driver': 'gpu.nvidia.com', 'pool': 'node-gpu-01',
  'device': 'gpu-0', 'request': 'gpu' } ]} }
              ↓
kubelet on node-gpu-01 sees the bound claim
              ↓
kubelet calls: gpu-kubelet-plugin.NodePrepareResources(claimUID)
              ↓
Driver writes CDI spec for the allocated device
              ↓
kubelet passes CDI device name to containerd
              ↓
containerd applies CDI spec → container starts with GPU access
The key difference from the device plugin flow: the scheduler has full visibility into device attributes and makes the allocation decision, rather than the plugin deciding inside an opaque gRPC call at pod start.
DRA vs Device Plugin Comparison
| Aspect | Device Plugin | DRA Driver |
|---|---|---|
| Resource discovery | gRPC ListAndWatch()
|
ResourceSlice Kubernetes objects |
| Resource request | resources.limits |
ResourceClaim / ResourceClaimTemplate
|
| Scheduler visibility | Opaque count only | Full attributes queryable via CEL |
| Allocation decision | Plugin at pod start | Scheduler at scheduling time |
| MIG support | Separate resource names per profile | CEL selectors on profile attribute |
| Multi-node NVLink | Not supported | ComputeDomain plugin (officially supported) |
| Shared GPU between containers | Not supported | Supported via shared ResourceClaim
|
| Kubernetes version | Stable since 1.10 | Beta since 1.32, GA (v1) from Kubernetes 1.34 |
Operations
Operating GPUs at scale, keeping the GPU Operator’s DaemonSets (and the MIG layouts they manage) healthy on real clusters, and Dynamic Resource Allocation (DRA), the next generation of GPU scheduling that succeeds the device plugin framework for fine-grained, topology-aware device allocation.
GPU Operator Troubleshooting
Common MIG issues
The GPU Operator and its MIG Manager (introduced in Who Actually Stands MIG Up in Part 2) do most of the day-to-day work of running MIG on a cluster, but the automation has sharp edges. Worth budgeting time for when you’re standing up a MIG-enabled node:
-
The MIG Manager treats “no label” as “no MIG.” If a node has no
nvidia.com/mig.configlabel at all, the manager’s default reconciliation target isall-disabledwhich will tear down any instances you carved by hand the moment the manager starts watching that node. Label the node before you touchnvidia-smi mig, not after. -
The manager only reacts to Kubernetes events, not hardware state. If you SSH in and change the MIG layout
directly with
nvidia-smi, the operator has no way to notice. The MIG Manager’s controller loop is driven by label watches, not a poll ofnvidia-smi mig -lgi. A stuck reconciliation usually means restarting thenvidia-mig-managerDaemonSet or toggling the label off and back on to force a re-evaluation. - The GI/CI hierarchy is enforced, not advisory. Attempting to delete a GPU Instance (GI) while a Compute Instance (CI) still lives inside it fails outright (“In use by another client”), and a slice with a running pod on it can’t be destroyed until that pod is evicted.
- New architectures need new container images. Blackwell-class cards need a CUDA toolkit and PyTorch/TensorFlow build compiled for that compute capability. So an older NGC image will schedule fine and then fail at the first kernel launch with an “unsupported” error that has nothing to do with Kubernetes.
-
You can’t see inside a slice from the outside. Because isolation is hardware-enforced, standard cluster GPU dashboards need per-slice telemetry (the DCGM exporter plus a MIG-aware Grafana dashboard), whole-GPU utilization graphs will just show the parent card and hide how the individual slices are actually being used.
A per-slice dashboard is already covered below: see the live Hardware Health dashboard under GPU Fleet Reliability and the per-MIG-slice memory/utilization panels under Utilization & Efficiency.
Fix: gpu-node-debug.sh automates the
checks behind the first two bullets above and the containerd mismatch below: it reads the nvidia.com/mig.config
node label and reconciliation state directly, cross-checks the GI/CI hierarchy via nvidia-smi mig, and
compares kubelet’s actual containerd instance against the operator’s configured CONTAINERD_SOCKET/
CONTAINERD_CONFIG.
Containerd: CDI vs Runtime Class and non-kube containerd instance
On a cluster running the DRA driver
instead of the device plugin, check the containerd drop-in the GPU Operator’s toolkit generates
(/etc/containerd/conf.d/99-nvidia.toml, or wherever CONTAINERD_CONFIG points) before assuming a
runtime-selection bug. Three things stand out:
#/etc/containerd/conf.d/99-nvidia.toml

version = 3

[plugins]

  [plugins."io.containerd.cri.v1.runtime"]
    cdi_spec_dirs = ["/etc/cdi", "/var/run/cdi"]
    ...
    enable_cdi = true

  [plugins."io.containerd.cri.v1.runtime".containerd]
      default_runtime_name = "runc"
      ...
      [plugins."io.containerd.cri.v1.runtime".containerd.runtimes]

        [plugins."io.containerd.cri.v1.runtime".containerd.runtimes.nvidia]
          ...
          [plugins."io.containerd.cri.v1.runtime".containerd.runtimes.nvidia.options]
            BinaryName = "/usr/local/nvidia/toolkit/nvidia-container-runtime"
            ...

      [plugins."io.containerd.cri.v1.runtime".containerd.runtimes.nvidia-cdi]
          [plugins."io.containerd.cri.v1.runtime".containerd.runtimes.nvidia-cdi.options]
            BinaryName = "/usr/local/nvidia/toolkit/nvidia-container-runtime.cdi"
            ...
-
default_runtime_name = "runc": plainruncstays the default; no need to setruntimeClassName: nvidiaunless the container needs GPUs (terms and conditions apply). -
enable_cdi = true,cdi_spec_dirs = ["/etc/cdi", "/var/run/cdi"]: this is what matters in a DRA+CDI setup: since containers get GPUs via CDI device injection (driven by the DRA driver, not by selecting a special runtime), a plain runc-launched pod still gets GPU access as long as CDI specs are present in one of those directories. - Three NVIDIA runtimes are registered anyway (
nvidia,nvidia-cdi,nvidia-legacy), each pointing at a different binary under/usr/local/nvidia/toolkit/, available for pods that opt in viaruntimeClassName, but not required.
Tracing one real pod (vllm qwen pod) through this confirmed all three points:
-
No runtime class used.
qwen’s pod spec hasruntimeClassNameempty: it runs under plainrunc, notnvidia/nvidia-cdi/nvidia-legacyeven with the new version of device plugin. -
An older device plugin version that isn’t CDI-aware, or a pod explicitly setting
runtimeClassName: nvidia, falls back to the container hook path discussed earlier. The GPU Operator’s container toolkit patches the default containerd config to add theseruntimesentries, but on distributions like MicroK8s or RKE that run their own containerd instance, that default path isn’t the one kubelet is actually reading. Point the toolkit at the wrong containerd instance and the runtime patch silently never lands, and GPU provisioning fails.FIX: Point the GPU Operator chart at the containerd instance kubelet actually uses.
   toolkit:
     enabled: true
     env:
     - name: CONTAINERD_CONFIG
       value: /var/lib/k8s-containerd/k8s-containerd/etc/containerd/config.toml
     - name: CONTAINERD_SOCKET
       value: /var/lib/k8s-containerd/k8s-containerd/run/containerd/containerd.sock
     - name: CONTAINERD_RUNTIME_CLASS
       value: nvidia
Installing the NVIDIA DRA Driver via Helm
The chart image for the DRA driver is served
from registry.k8s.io/dra-driver-nvidia/dra-driver-nvidia-gpu. GPU allocation is gated behind
gpuResourcesEnabledOverride=true because it is still experimental: the upstream README is explicit that “GPU
allocation features can be tried out” but “are not yet officially supported,” which is why the Helm chart leaves
the GPU kubelet plugin disabled unless you opt in.
helm upgrade -i \
  --create-namespace \
  --namespace gpu-operator \
  dra-driver-nvidia-gpu \
  oci://registry.k8s.io/dra-driver-nvidia/dra-driver-nvidia-gpu \
  --set gpuResourcesEnabledOverride=true \
  --wait

# Verify: each GPU node should show a 2-container pod
kubectl -n gpu-operator get pods | grep dra
nvidia-dra-driver-gpu-controller-699474f64f-h7ppr                 1/1     Running     0               4h17m
nvidia-dra-driver-gpu-kubelet-plugin-gps66                        2/2     Running     0               42m
Requires Kubernetes 1.32+ with the DynamicResourceAllocation feature gate enabled.
A second, more opinionated install path runs through the NVIDIA GPU Operator itself (v26.3.3+ ships DRA support as a documented install target rather than a bare Helm chart), that route is worth knowing about because its prerequisites are noticeably stricter than “1.32+ with the feature gate on”:
- Kubernetes v1.34.2+ (bump to v1.36.0+ if you intend to mix traditional
resources.limits.nvidia.com/gpurequests with DRA claims on the same cluster) - GPU driver 580+, with CDI enabled in the container runtime
- Node Feature Discovery and GPU Feature Discovery already deployed
- GPU nodes labeled
nvidia.com/dra-kubelet-plugin=true, and the traditional NVIDIA Device Plugin disabled on those nodes, since the two allocation paths aren’t meant to run against the same GPUs at once
Two operational rough edges are worth planning around before you rely on this in a real cluster:
-
The NVIDIA Driver Manager doesn’t cleanly evict the DRA kubelet plugin when it needs to reload the driver:
the documented workaround is to pass the DRA node labels through
driver.manager.envso the manager knows to drain it first. -
A100 MIG reconfiguration doesn’t auto-propagate to the DRA plugin. After changing a MIG layout on an A100,
the
gpu-kubelet-pluginneeds a manual restart to pick up the newResourceSliceshape; it won’t notice on its own the way the MIG Manager does for the device-plugin path (Part 2).
And if you’re upgrading an existing install from the pre-v0.4.0 chart generation, set nameOverride=nvidia-dra-driver-gpu
explicitly: omitting it produces duplicate manifests alongside the old release instead of replacing it.
Downgrading back past v0.4.0 isn’t supported once you’ve moved forward.
GPU Fleet Reliability: Metrics and SLOs
Everything above gets a GPU into a container. None of it tells you whether the fleet is actually healthy, and
for GPU capacity specifically, “healthy” means more than “the pod is Running.” A GPU node that’s up but silently
throttling, a MIG slice that’s been torn down and never noticed, or a ResourceClaim that’s been sitting
unallocated for ten minutes are all outages that look fine from a plain kubectl get pods. SLOs for a GPU fleet
could be split into four categories. The last one is the category the tooling is worst at surfacing on its own.
1. Hardware Health
This is what DCGM (Data Center GPU Manager) exists for, and it’s the one
category with mature, off-the-shelf tooling: dcgm-exporter, deployed as a GPU Operator component
(dcgmExporter.enabled, on by default), exposes per-GPU and per-MIG-instance Prometheus metrics with no extra
config. Per-pod attribution is a separate, optional flag (enablePodLabels: true); see the caveat about it
under Utilization & Efficiency below, because it doesn’t actually work on a
DRA-based cluster. The fields that actually belong in an SLO, as opposed to a dashboard nobody looks at:
| Metric | What it means | SLO framing |
|---|---|---|
DCGM_FI_DEV_XID_ERRORS |
Driver-level fault code: anything from a benign transient to a fatal ECC/Xid 79 “GPU has fallen off the bus” | Don’t alert on “non-zero”: verified live, the series is simply absent when healthy (DCGM returns a blank value, and the exporter drops it rather than emitting 0), so there’s nothing to compare against. Add DCGM_EXP_XID_ERRORS_TOTAL instead: an exporter-owned counter, opt-in and commented out in the default CSV, that only creates a series once an XID actually fires; alert on that series existing, via increase(...) > 0. |
DCGM_FI_DEV_ECC_DBE_VOL_TOTAL |
Uncorrectable (double-bit) ECC memory errors | Any increase → page. Silent data corruption risk, not just a reliability blip. |
DCGM_FI_DEV_ECC_SBE_VOL_TOTAL |
Correctable (single-bit) ECC errors | Trend, don’t page on one: a rising rate predicts a DBE and a future Xid. |
DCGM_FI_DEV_THERMAL_VIOLATION / DCGM_FI_DEV_POWER_VIOLATION
|
Time spent throttled by thermal or power limits | Non-zero over a sustained window means the workload isn’t getting the compute the profile promised: a MIG 4g.40gb throttled to 60% clock isn’t really 4g.40gb anymore. |
DCGM_FI_PROF_GR_ENGINE_ACTIVE |
Fraction of time an SM has a warp resident, the real utilization signal | Prefer this over DCGM_FI_DEV_GPU_UTIL, which only reports “was any kernel running,” not how much of the card that kernel actually used. A GPU can show 100% GPU_UTIL while running a memory-bound kernel that uses 5% of the SMs. |
DCGM_FI_DEV_FB_USED / DCGM_FI_DEV_FB_FREE
|
Framebuffer (VRAM) used/free | Capacity planning input, and the fastest way to catch a memory leak before it OOMs a neighbor. |
What actually gets exposed is a separate concern from scraping it, and worth checking directly
rather than assuming: GPU Operator’s own baked-in metrics list (dcp-metrics-included.csv) covers
utilization/clocks/memory/PCIe/energy but omits every field in the table above: no XID, no ECC, no thermal or
power violation. Getting them requires pointing dcgmExporter.config.name at your own ConfigMap with a superset
dcgm-metrics.csv (the exporter reads a three-column DCGM field, prometheus type, help text CSV):
# GPU Operator values
dcgmExporter:
  enablePodLabels: true   # per-pod attribution: see the DRA caveat below
  serviceMonitor:
    enabled: true
  config:
    name: custom-dcgm-metrics   # ConfigMap with a dcgm-metrics.csv adding
                                 # DCGM_FI_DEV_XID_ERRORS, DCGM_EXP_XID_ERRORS_TOTAL,
                                 # ECC_SBE/DBE_VOL_TOTAL, THERMAL_VIOLATION,
                                 # POWER_VIOLATION, etc.
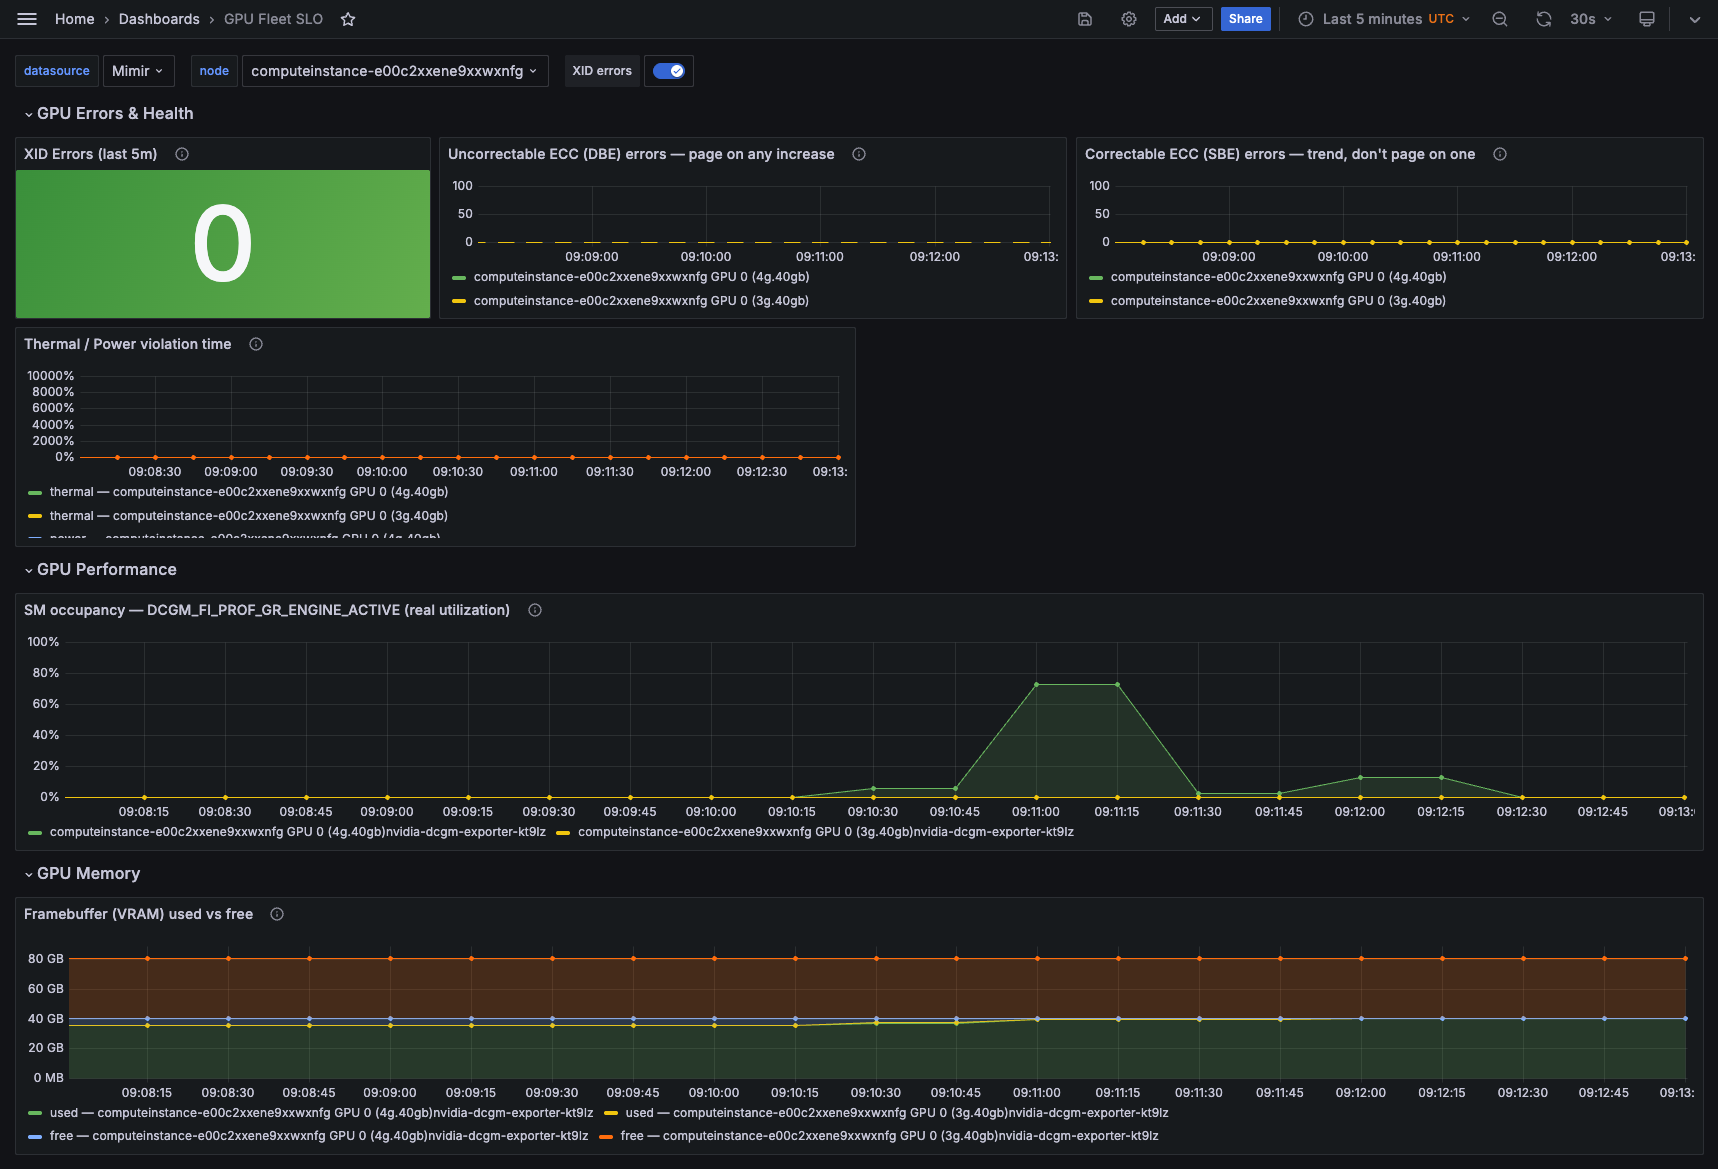
Every metric from the table above, live on one node: XID Errors sits at a clean 0, via
DCGM_EXP_XID_ERRORS_TOTAL, not the blank-value gauge and SM occupancy (GR_ENGINE_ACTIVE) shows the
4g.40gb slice doing work while its 3g.40gb sibling sits idle, the same per-slice split called out
under Utilization & Efficiency below.
2. Scheduling & Allocation Latency
“Time from pod submitted to GPU compute actually running” is the SLI that maps most directly to user-visible pain. A training job that queues for 40 minutes waiting on a GPU is a very different incident from one that starts in 4 seconds, even though both eventually succeed. The two allocation paths expose this very differently:
-
Device Plugin path:
kube_pod_status_scheduledcombined withnvidia.com/gpuallocatable/capacity gives you time-to-schedule. TheAllocate()gRPC call itself isn’t instrumented by default if you need that granularity, it’s a custom metric on top of the device plugin, not something you get for free. -
DRA path: there’s no mature off-the-shelf histogram for this yet. The
ResourceClaimis still a young API, and the ecosystem’s observability tooling (kube-state-metrics support, standard Grafana dashboards) hasn’t fully caught up to it the way it has for pods and deployments. What is directly observable, because we relied on it throughout this series’ troubleshooting, is the claim’s own state:kubectl get resourceclaims -n qwen NAME STATE AGE vllm-qwen2-5-7b-65f4bfc79f-rdh4n-gpu-5b7cb allocated,reserved 6sA claim sitting in
pending(emptystatus: {}, nostatus.allocation) for longer than your allocation SLO is the DRA-native signal to alert on: poll it, or better, watch theFailedSchedulingevent on the pod, which carries the actual reason (cannot allocate all claims,untolerated taint,didn't match node affinity). Treat “claim pending > N minutes” as page-worthy in exactly the way “pod pending > N minutes” already is for CPU-only workloads. -
When autoscaling is in play, “pending” starts before the pod does. A scale-up adds a new node, and none of the metrics above cover node-launch to node-ready to driver-ready, a gap invisible to both the Device Plugin and DRA signals above, since neither starts watching until the node is already
Ready. A lifecycle tracer spanning that full path through tomodel-readyturns “why did this take N minutes” into an answer: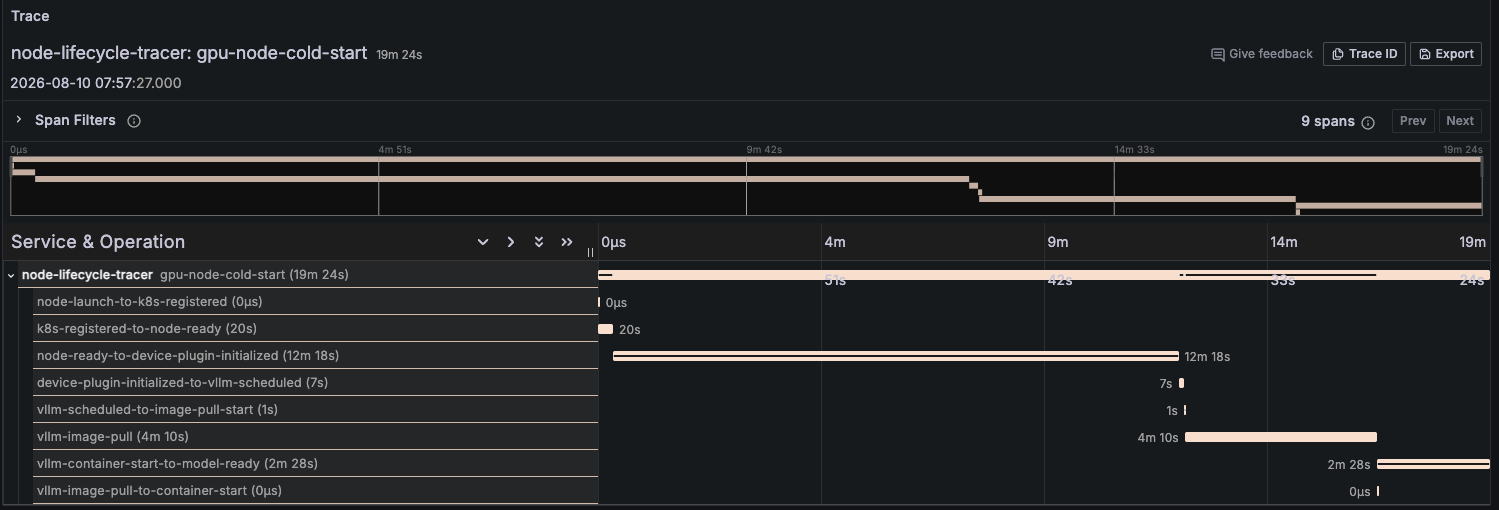
Device Plugin path, 19m24s total:
node-ready-to-device-plugin-initializedwas 12m18s of it. The obvious read is “driver install is slow,” but breaking that span down by GPU Operator sub-component (NFD → driver → toolkit → MIG Manager → device plugin) shows otherwise: actual driver module load/init is ~1m, MIG and device-plugin registration are each under a minute; the two big chunks are operator reconcile delay before the driver DaemonSet is even created (~5m) and DaemonSet/CNI scheduling before NFD starts (~3m). Neither is “work” you can bake into an image. That’s the case for tracing here: without sub-spans, “driver install” is a plausible-sounding, wrong optimization target.
3. Control-Plane Reconciliation Correctness
This is the category the tooling is genuinely weakest at, and, as covered across
GPU Operator Troubleshooting and
Installing the NVIDIA DRA Driver via Helm, where the real incidents
in a MIG + DRA fleet come from. None of these show up as a failed pod; they show up as a pod stuck
Pending for reasons that look, from the outside, exactly like “the cluster is out of capacity” when it isn’t.
-
nvidia.com/mig.config.stateas a literal state machine. The MIG Manager writespending→successorpending→failedonto the node after every reconfiguration attempt.failedis unambiguous and immediately actionable; alert on it directly rather than inferring it from downstream symptoms:# kube-state-metrics exposes node labels as a gauge; alert on the literal value # (requires --metric-labels-allowlist covering this label, off by default) kube_node_labels{label_nvidia_com_mig_config_state="failed"}In practice
failedusually means a GPU-consuming pod wasn’t evicted before the manager tried to touch the layout (ERROR_IN_USEfromnvidia-smi mig -cgi); see the eviction point below, they’re the same root cause wearing two different symptoms. -
ResourceSlicestaleness: a silent, not a loud, failure. The DRA kubelet-plugin enumerates GPU/MIG topology via NVML once at process startup and caches it. A MIG reconfiguration can succeed completely at the hardware level:nvidia-smi -Lshows the new instances immediately while theResourceSlicethe scheduler actually reads keeps advertising the old device shape indefinitely, because nothing tells the kubelet-plugin its cached view is stale. There’s no error, no event, no failed reconciliation, just a scheduler that keeps allocating against devices that no longer exist in that shape. The only fix is restarting the plugin pod after any MIG topology change; there’s no notification path that makes this automatic today. Track it operationally as: MIG config change → wait formig.config.state=success→ restart*-kubelet-plugin→ verify theResourceSlicedevice list actually changed before assuming the change took effect. Skip the last step and you’ll ship a config change that silently does nothing. -
Pod eviction during driver reloads.
gpu-operator’sdriver.managerinit container evicts GPU-consuming pods before reloading the kernel module but out of the box it only knows how to find classic device-plugin consumers. A DRAResourceClaimpod is invisible to it unlessdriver.manager.envis explicitly pointed at the node label identifying DRA-eligible nodes:driver: manager: env: - name: NODE_LABEL_FOR_GPU_POD_EVICTION value: nvidia.com/dra-kubelet-pluginWithout this, a routine driver upgrade can restart the driver DaemonSet out from under a running DRA pod instead of draining it first; the pod doesn’t necessarily crash, but its GPU access can end up in an undefined state until it’s manually cycled. The SLI here is binary and worth its own alert: did every GPU-consuming pod on a node get cleanly evicted and rescheduled around a driver reload, or did any of them survive the reload in place (
kube_pod_start_timeunchanged across anvidia-driver-daemonsetrollout on the same node is the tell). -
Single-instance GPU +
RollingUpdateis a deadlock, not a slow rollout, on a fixed node pool. ADeploymentpinned to a scarce GPU (whole-device or a single MIG slice) with the defaultRollingUpdatestrategy will try to schedule the new pod and its new claim before freeing the old one’s device. With exactly one instance of that shape and no room to grow, this can’t ever succeed: the new pod staysPendingforever, and the old pod is never torn down because the rollout hasn’t progressed.kubectl rollout statushanging past its usual duration on a GPU workload is the signal;strategy: { type: Recreate }is the fix. The exception is cluster autoscaler adding a same-shape node so the new pod schedules there instead, and that’s markedly more reliable on DRA, whose structuredResourceSlice/DeviceClassmodel the autoscaler can actually simulate against, than on the device plugin, where MIG-shaped extended resources are mostly opaque to that simulation. Default toRecreateon device plugin; on DRA with real autoscaling headroom, verify a rollout withRollingUpdateactually lands on a new node before trusting it.
4. Utilization & Efficiency
Not an availability SLO in the classic sense, but on hardware this expensive, “the fleet is up” and “the fleet is being used” are different questions worth tracking separately:
-
Per-slice, not per-card, utilization. As noted back in
GPU Operator Troubleshooting: a whole-GPU dashboard built on
DCGM_FI_DEV_GPU_UTILhides exactly the number you need once MIG is involved: it reports the parent card’s aggregate state, not what each4g.40gbor3g.40gbinstance is individually doing. This part works out of the box:dcgm-exporterlabels every metric withGPU_I_ID/GPU_I_PROFILEper MIG instance with no configuration needed. Confirmed live: one instance reading36038MiB used (the actual workload), the sibling3g.40gbslice reading43MiB (idle). -
Per-pod attribution is a separate feature, and it doesn’t work under DRA.
dcgmExporter.enablePodLabelsis what’s supposed to addpod/namespace/containerlabels on top of the per-slice ones above, so usage can be attributed to a workload rather than just a device. Tested directly against a DRA-allocated MIG slice: withDCGM_EXPORTER_KUBERNETES_ENABLE_POD_LABELS=trueconfirmed present in the container’s own env, the raw/metricsoutput still carries no pod/namespace/container label at all, same per-slice series as the unattributed case above. The mechanism relies on the kubeletpodresourcesgRPC API, which classic device-plugin allocations populate and DRAResourceClaimallocations do not. Practically: on a DRA-based cluster, “which pod is using this slice” isn’t answerable fromdcgm-exporteralone: you’d need to joinGPU_I_ID/UUIDagainst the DRA driver’s ownResourceClaim.status.allocationdata yourself (e.g. a recording rule or sidecar exporter), because nothing upstream does that join today. -
Idle-slice ratio.
count(mig instances with near-zero DCGM_FI_PROF_GR_ENGINE_ACTIVE) / count(total mig instances)over a rolling window is a direct cost signal: an idle3g.40gbslice sitting unclaimed is the same wasted spend as an idle whole GPU, just smaller and easier to lose track of because it doesn’t show up as a distinct line item anywhere. -
Fragmentation. The homogeneous-vs-heterogeneous
mig-partedtrade-off means a naiveall-<profile>config can leave real, unallocated capacity permanently invisible, a singleall-4g.40gbconfig on an 80GB H100 only ever creates one instance and leaves the remaining ~40GB/3 compute slices unpartitioned, not merely idle.sum(DCGM_FI_DEV_FB_FREE)at the node level will look fine even while this is happening; catching it requires comparing the physical GPU’s total capacity against what’s actually been carved intoResourceSlicedevices, not just what’s allocated out of what was carved.
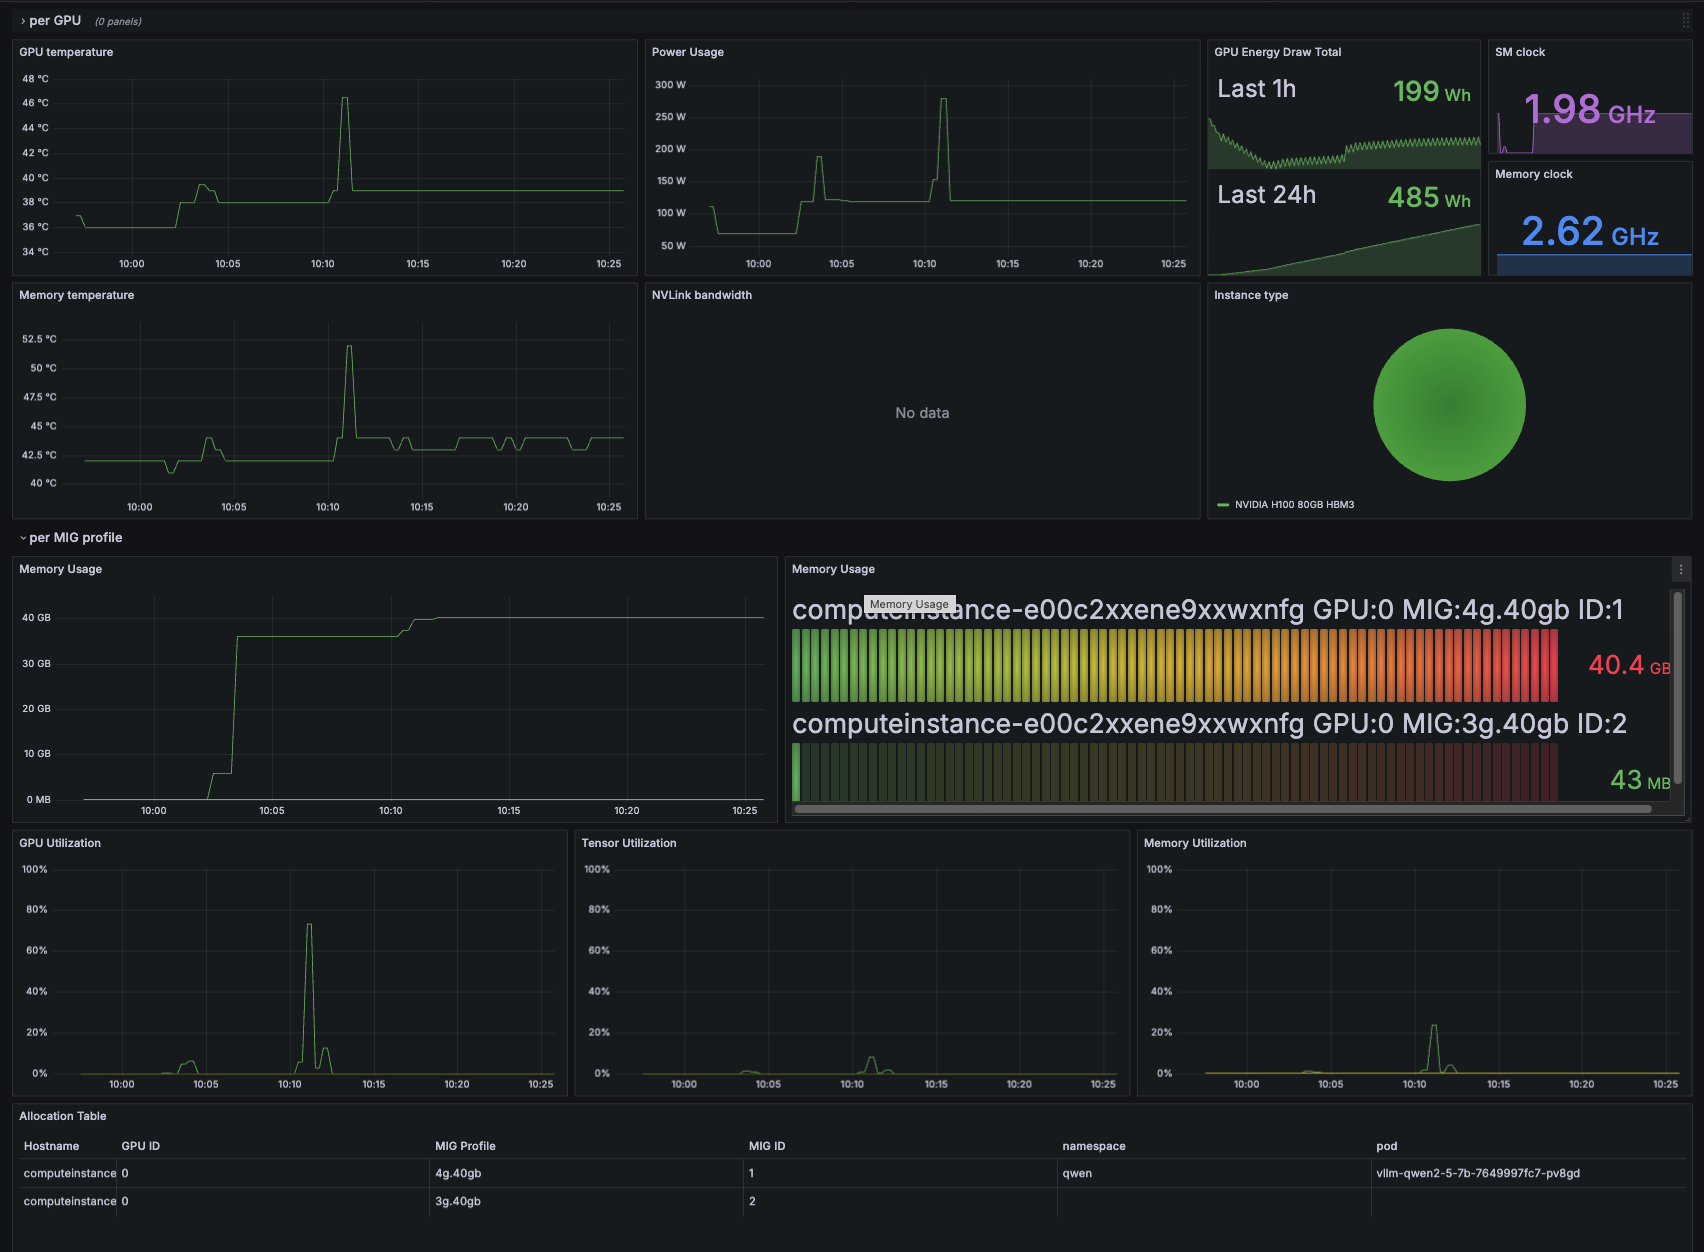
NVIDIA DCGM Dashboard for Kubernetes (MIG & Non-MIG GPUs)
puts both of the points above on one screen: per-slice memory and utilization panels show one 4g.40gb profile
doing real work while its 3g.40gb sibling sits idle (43 MB used, matching the idle reading cited earlier), and
its Allocation Table resolves that busy slice to namespace qwen and pod vllm-qwen2-5-7b-7649997fc7-pv8gd,
one concrete version of the manual join described above.
A Minimal SLO Set
Pulling the above into something an on-call rotation could commit to:
| SLI | Target | Primary signal | Severity on breach |
|---|---|---|---|
| GPU hardware fault rate | Zero Xid/DBE events per node per week |
DCGM_EXP_XID_ERRORS_TOTAL, DCGM_FI_DEV_ECC_DBE_VOL_TOTAL
|
Page |
| MIG reconciliation success | 100% of mig.config changes reach state=success within 5 min |
kube_node_labels{label_nvidia_com_mig_config_state} |
Page |
| GPU allocation latency | p95 claim/pod pending → Running < 2 min (steady-state capacity) |
ResourceClaim state / kube_pod_status_scheduled
|
Warn → page if sustained |
| Driver-reload eviction correctness | 100% of GPU pods rescheduled (not survived-in-place) across a driver DaemonSet rollout |
kube_pod_start_time vs DaemonSet rollout window |
Page |
| Sustained thermal/power throttling | < 1% of GPU-active time under violation |
DCGM_FI_DEV_THERMAL_VIOLATION, DCGM_FI_DEV_POWER_VIOLATION
|
Warn |
| Fleet utilization |
|
Per-slice DCGM metrics | Info / capacity planning |
None of this replaces the operational habits from the troubleshooting sections above: a green dashboard doesn’t
mean a MIG reconfiguration actually propagated, and the only way to be sure is still the manual
verify-after-every-change discipline those sections describe. Metrics catch drift and hardware faults; they don’t
substitute for knowing that a ResourceSlice needs a kubelet-plugin restart to reflect a change that already
happened underneath it.
Everything above is what to measure. Below is the short version of when: Day 1 setup, Day 2 runbook, and the three signals worth checking, in the order to check them.
Observability: Check in This Order
-
State fields, first, always:
mig.config.state, whetherResourceClaim.status.allocationis populated. Every incident in the runbook above was actually diagnosed here, not in a dashboard. -
DCGM metrics: per-slice via
GPU_I_ID/GPU_I_PROFILE(present by default); fault fields only if the Day 1 customdcgm-metrics.csvis wired in. -
Traces: vLLM’s own spans for per-request latency (queue time, TTFT, prefill/decode); a separate
lifecycle tracer for cold-start latency (
scheduled → image-pull → container-start → model-ready). Different questions: request-level tracing can’t see cold-start time, it only starts once the model is serving.
Conclusion
Let’s summarize the GPU container enablement flow:
Device Plugin Flow
DRA Flow
Key Components
GPU Device Plugin (Traditional Path)
- Discovers GPU resources on the node and advertises them to Kubernetes via the gRPC
ListAndWatchAPI. - Runs as a DaemonSet and manages GPU allocation to pods.
NVIDIA DRA Driver (Modern Path): kubernetes-sigs/dra-driver-nvidia-gpu
- Publishes structured
ResourceSliceobjects describing each GPU’s attributes (gpu.nvidia.com) and MIG slices (mig.nvidia.com). - Implements
NodePrepareResourcesso kubelet can activate allocated devices via CDI. -
gpu-kubelet-plugin(experimental) handles CEL-based GPU/MIG selection and lifecycle management. -
compute-domain-kubelet-plugin(supported) orchestrates Multi-Node NVLink / ComputeDomain. - Requires Kubernetes 1.32+ with the
DynamicResourceAllocationfeature gate enabled.
Kubelet
- The node agent that manages pod lifecycle.
- Talks to device plugins (traditional path) or DRA driver plugins (DRA path), and to the container runtime.
Container Runtime (containerd)
- Creates containers and integrates with the NVIDIA Container Toolkit or CDI.
- Mounts GPU devices into containers.
NVIDIA Container Toolkit / CDI
- The runtime hook that provides GPU container creation on the legacy path.
- CDI is the modern, vendor-neutral alternative: declarative YAML specs written to
/etc/cdi/(static, admin-generated) or/var/run/cdi/(dynamic, generated by the DRA driver at runtime).
GPU Hardware Layer
- The physical NVIDIA GPUs and the
nvidia.kokernel driver underneath everything above: every other component in this list exists to get a pod safely down to this layer.
This wraps up the series: Part 1 (provisioning), Part 2 (sharing), and this post (CDI, DRA, and operations) together trace the full path from silicon to a running CUDA workload on Kubernetes, and what it takes to keep it running.
Key Takeaways
- This series traces one path end to end: Part 1’s device-plugin flow gives a pod exclusive access to a whole GPU, Part 2’s five strategies split that GPU further, and the CDI/DRA infrastructure covered in this part (see Key Components above) is what both of those layers actually run on under the hood.
- The MIG Manager and DRA kubelet-plugin only react to events, not live hardware state, so a MIG layout changed outside Kubernetes (or a
ResourceSlicegone stale after a reconfiguration) needs a manual nudge to reconcile.- A GPU fleet SLO needs four categories: hardware health (XID/ECC/thermal via DCGM), scheduling and allocation latency, control-plane reconciliation correctness, and utilization/efficiency, the last being the one existing tooling surfaces worst.